


This article is part of our Collette Calls series.
One of the things we are always trying to do in fantasy baseball is identify who may break out or change their current course. For pitchers, we look at gaps between ERA and FIP, or more accurately, DRA. Hitting has not always been as easy. For years, we would look at high or low BABIP's or home run to flyball ratio and try to predict what would happen in the coming week.
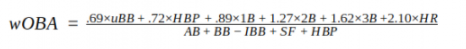
The good news around that is the tools we have to work on such predictions are becoming more accurate, thanks to the great work around StatCast and the people doing the research around what is being measured. Weighted On-Base Average (wOBA) recognizes that not all hits are created equal whereas batting average does. Batting average does not care how many bases the batted ball resulted in, it just cares that X number of hits in Y number of plate appearances equals an average. It is the simplest way for fans at a game or looking at a box score to get a feel for how a hitter is doing at the plate. It is far from accurate and not a decent measure for offensive contribution, but it will likely live on for awhile because it is easy to explain. wOBA is not so easy. After all, look at the formula for computing wOBA:
Imagine explaining that one to your mom and dad the next time you go to the ballpark? As the formula shows, not all hits are
One of the things we are always trying to do in fantasy baseball is identify who may break out or change their current course. For pitchers, we look at gaps between ERA and FIP, or more accurately, DRA. Hitting has not always been as easy. For years, we would look at high or low BABIP's or home run to flyball ratio and try to predict what would happen in the coming week.
The good news around that is the tools we have to work on such predictions are becoming more accurate, thanks to the great work around StatCast and the people doing the research around what is being measured. Weighted On-Base Average (wOBA) recognizes that not all hits are created equal whereas batting average does. Batting average does not care how many bases the batted ball resulted in, it just cares that X number of hits in Y number of plate appearances equals an average. It is the simplest way for fans at a game or looking at a box score to get a feel for how a hitter is doing at the plate. It is far from accurate and not a decent measure for offensive contribution, but it will likely live on for awhile because it is easy to explain. wOBA is not so easy. After all, look at the formula for computing wOBA:
Imagine explaining that one to your mom and dad the next time you go to the ballpark? As the formula shows, not all hits are created equal and wOBA combines all the different aspects of hitting into a single metric weighting each of them proportionately to their actual run value. In short, wOBA is a more accurate measure of offensive productivity than batting average, on-base percentage or slugging percentage. For a longer definition of wOBA, please see the Fangraphs library.
wOBA alone cannot help you predict what a batter will do moving forward, but its cousin xwOBA can help. The x stands for expected and is defined by StatCast as:
Expected weighted on-base average (xwOBA) is formulated using exit velocity and launch angle, two metrics measured by Statcast.
In the same way that each batted ball is assigned a Hit Probability, every batted ball has been given a single, double, triple and home run probability based on the results of comparable batted balls -- in terms of exit velocity and launch angle -- since Statcast was implemented Major League wide in 2015.
All hit types are valued in the same fashion for xwOBA as they are in the formula for standard wOBA: (unintentional BB factor x unintentional BB + HBP factor x HBP + 1B factor x 1B + 2B factor x 2B + 3B factor x 3B + HR factor x HR)/(AB + unintentional BB + SF + HBP), where "factor" indicates the adjusted run expectancy of a batting event in the context of the season as a whole.
Knowing the expected outcomes of each individual batted ball from a particular player over the course of a season -- with a player's real-world data used for factors such as walks, strikeouts and times hit by a pitch -- allows for the formation of said player's xwOBA based on the quality of contact, instead of the actual outcomes. Likewise, this exercise can be done for pitchers to get their expected xwOBA against.
Why is it useful? Because it removes defense from the equation. The original beliefs of BABIP stated that hitters could only control so much of their batted ball outcomes but we have now come to realize that batters do have more control by determining how hard to swing and at what angle. Once the ball leaves the bat, they give up control but the events leading up to the moment of contact are completely in the batter's control. Take this play from April where Josh Reddick robs a would-be home run from Jason Kipnis:
In the wOBA formula, there is no inputs for outs, so that play is a non-factor, but xwOBA recognizes that ball should have been a home run. So, one way we can start looking for guys that could have better, or worse, days ahead is to use the xwOBA-wOBA leaderboard over at BaseballSavant.
Heading into play Sunday, these were the 10 largest underperformers by xwOBA-wOBA:
Note that there are three Detroit Tigers in the top six spots, and that is because of Comerica Park. The gaps in left and right center are very deep, so hard hit balls to those parts that would be home runs elsewhere go for long outs. StatCast covered it in a video two weeks ago showing three batted balls that would have been home runs just about everywhere else but were just long outs in Comerica:
It also does not help that a number of the guys on this list are not fleet of foot, especially Cabrera and Morales. Balls they crush to the gap that are certain extra-base hits for others are not always for them.
Todd Frazier is intriguing because he is struggling mightily in what is a walk year in Chicago coming off a season where he hit 40 homers. To put wOBA in context of what is great, good, etc, we'll look at the chart at Fangraphs:
Frazier's wOBA is between poor and awful, but his xwOBA is above average. Perhaps finally being dealt in the coming weeks could put him back on track and flip those numbers around. As it were, he is rather available in leagues because of his terrible batting average. Khris Davis won't be dealt anywhere, but he too is not hitting for average but he is making a lot of loud and long contact. He won't come at any discount if you try to acquire him, but if you are rostering him, there could be better days ahead for his average as he has hit .244-.247 each of the past three seasons compared to the .215 he is currently hitting while striking out at the highest rate of his career.
Davis's teammate, Matt Joyce, was pegged as a breakout slugger when the A's made the move to acquire him. We are still waiting for his breakout, and since it did not happen in the month of May (see his career monthly splits), it may not come. Or will it?
If we use his launch angle spray charts from last year and this year, see if you spot the difference?
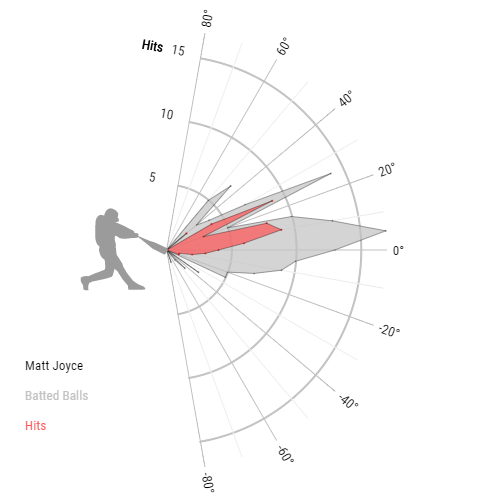
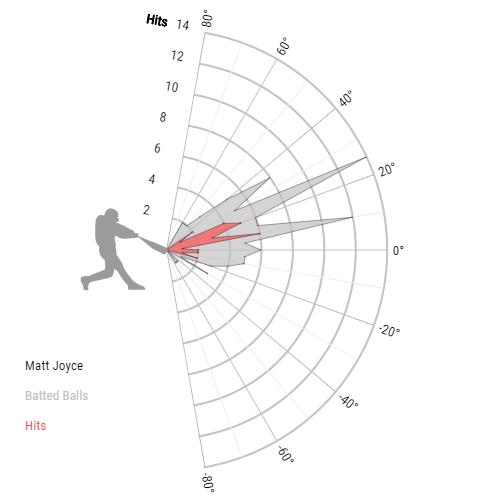
2016 is on the left and 2017 is on the right. The area in red are hits and gray represents his batted balls. Note that more than half of the balls he hit with ~20 degrees of launch went for hits. Now, look at how many batted balls in that range he has hit this year and now many fewer have become hits. That's how you can visualize Joyce's unluckiness in terms of Woba. He is hitting the right types of balls to become hits based off angles, but they're not becoming extra base hits in Oakland like they were last year in Pittsburgh.
Kyle Seager and James McCann are both doing average in terms of wOBA, but have room for improvement while Maikel Franco and Kyle Schwarber could potentially get to that average barrier but look a lot different these days than they did last year.
If you are curious as to which players are currently overperforming their xwOBA, see the list is below. Since Dickerson and Altuve are currently driving my second-place AL Tout Wars team, I am rather concerned. It is worth noting that Mark Reynolds, someone I said last week would not exceed 25 homers this season, is on this list as well.


